Using Analytics to improve the User Experience
By Team Arrk |
|
5 mins read |

At Arrk, we start any new project with something called EmbArrk™. It is usually a two-week (sometimes shorter, sometimes longer) series of intensive workshops that kick-starts a project and manages to generate such animation and buzz within the Arrk and customer team, that it is a challenge to not begin the project immediately.
A key component of an EmbArrk™ is the research groundwork that our Researchers, Experience Consultants and Business Analysts put in prior to the EmbArrk™ start date. This groundwork includes some or all of the following:
- Narrative interviews
- Ethnographic research
- Field trips
The outcomes from these activities provide the Arrk team with a deep understanding of the End User – their needs, desires, fears and relationship with the existing product/service.
So what is the problem?
All the above is a very mature, tested and deployed method (refined and improved over many customer engagements) of acquiring, codifying, collating, presenting and making use of Qualitative knowledge. Which is great, we start a project with a massive empathy that drives the decisions and designs produced.
During the project development period (Arrk uses an Agile methodology, so Sprints) we iteratively create a digital product that can be tested and qualitatively assessed.
So far so good, but, how do we really know if we are making something that improves upon what has gone before? Something that reduces an end user’s error rate, or increases their productivity. In short, we don’t.
This has been a large hole in a qualitatively driven user experience model, which had to be addressed.
What can be done?
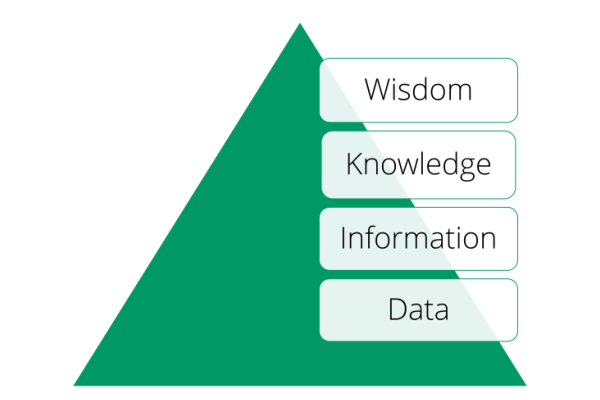
The bedfellow of qualitative knowledge is quantitative knowledge, you’ll notice that I’m saying knowledge, not data or information. Data is meaningless without context, and is of little use until it has been processed into usable information. But information is only part of the journey, we take this further, looking at the DIKW pyramid and applying experience and skill we can distill knowledge and ultimately wisdom from information.
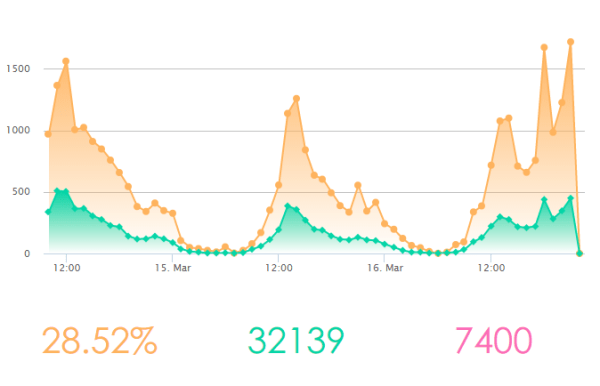
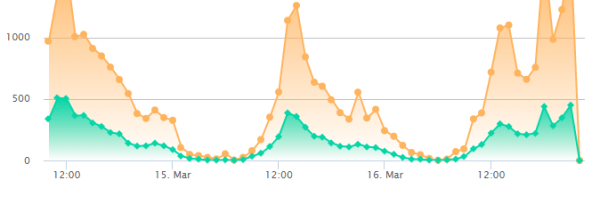
Being adept digital engineers, we use New Relic and Google Analytics to gain insights into how end users are using the digital product. The raw data from these services is processed by the team into knowledge that enables us to see how our design decisions, are reflected in user behaviour.
Examples
Quite often we reach design impasses, in that we have a distinct branch in a product’s design, and the outcome from making this choice has a fundamental effect on the whole product’s development style. In this case, we would set up a simple A/B test. The mechanics of this being that as we tend to develop using virtual servers, it’s a simple (I’m not allowed to say trivial) task to create a pair of servers with the two design branches. The servers are then used to alternative between product users, and their behaviour is observed using New Relic/Google Analytics. As the outcome of this test is (relatively) easy to objectively demonstrate which solution works best, we can make the best design decision.
For those of you who may think that this sounds expensive with regard to effort and time, this has to be balanced against the cost of getting it wrong. I believe that we (the IT industry) are conditioned to building monolithic structures with strong analogies to physical world processes such as building architecture or car manufacture. When in actual fact we are presenting a fleeting, almost ethereal manifestation of a product or service, which has real world outcomes – Eg. A hotel is booked, a taxi is ordered, a cancer therapy is assigned. With this mindset, the abilities such as re-arranging an order form’s sequence, or the arrangement of an interactive sequence is approached correctly.
A second example is of funnel filtering. We often build a process that has a linear sequence that makes sense to the designers and developers. However, the end user hasn’t been privy to the design session where we’ve determined how they should act, and therefore is able to take the most oblique route through our system. Often though, the end user will reach an impasse, and be prevented from completing their task.
In a live product, or during any of the early stages of a soft launch, or alpha release, it becomes an overwhelming task to continually monitor the service using qualitative methods (through interviews or observations), and so we use analytic tools to watch the users for us.
Funnel filtering is a technique by which we can model the presumed path we expect a user to take through our software. This will be the path that most effort has been taken to ensure that the process logic is a ‘usable’ as possible. The analytics tracker then monitors the users to see whether progress matches our model. The knowledge derived from this monitoring will identify whether our model is correct, and more importantly highlight stumbling blocks that slow a user down, or cause them to abandon the process completely.
Notice that funnel filtering analytics does not provide the solution, or even identify the actual issue, it does, however, enable us to know where to look for the issue.
I’ve demonstrated how quantitative knowledge provides us with a tool as valuable as qualitative knowledge in an Agile project. The natural complement to an Agile project is to run it Lean as well. To be lean we must be able to demonstrate that the outcomes from our actions have a (hopefully) positive impact for the end user, and quantitative knowledge is the most appropriate tools for this.
I’ve written about analytics within the context of an EmbArrk™ led project, and as a part of our project process. The skills we use are directly transferable to an existing product, project in production, or as an evaluation tool, used to determine the best direction for a product’s development.


